At Nexoya, one of the key validation methods we use to measure the impact of our interventions is Causal Impact Analysis. Understanding how this method works and interpreting its results can unlock valuable insights into the effectiveness of marketing decisions.
In today’s blog, we will break it down for you in simple terms and explain its significance and applications, helping you better leverage data-driven insights for your business.
Without further ado, let’s dive in!
Table of Contents:
- What is Causal Impact?
- Causal Impact Analysis: How Does it Work?
- Interpreting the Results
- Applications of Causal Impact Analysis
- Causal Impact Analysis at Nexoya
What is Causal Impact?
Causal Impact is a powerful statistical method that helps you measure the effect of an intervention or event on a time series. Developed by Google, it uses Bayesian structural time-series models to compare observed outcomes with what would have happened if the intervention hadn’t occurred—a scenario known as the counterfactual.
Simply put, Causal Impact answers the question:
“What would the data look like if no intervention had been made?”
This method is incredibly valuable in fields like marketing, economics, and healthcare, where understanding the real impact of specific changes or strategies is critical.
The Causal Impact is one of the many synthetic control techniques that can be used as a proxy for A/B testing. This is particularly useful when building and setting up an A/B testing is impractical to implement.
Causal Impact Analysis: How Does it Work?
To calculate the causal effect, Causal Impact relies on three key elements:
- A pre-intervention period: Real data from a period before the intervention to establish a baseline.
- A post-intervention period: Data collected after the intervention has taken place.
- Counterfactuals: External factors or events that can explain trends in the data if no intervention had occurred.
The counterfactual scenario acts as a control group, predicting what would have happened without the intervention. By comparing this scenario with the observed outcomes, you can isolate the true effect of your intervention.
For accurate results:
- The pre-intervention period should be 2-3 times longer than the post-intervention period.
- The model considers alternative explanations (counterfactuals) to rule out other potential causes for observed changes.
To better understand how Causal Impact works, let’s look at a practical example:
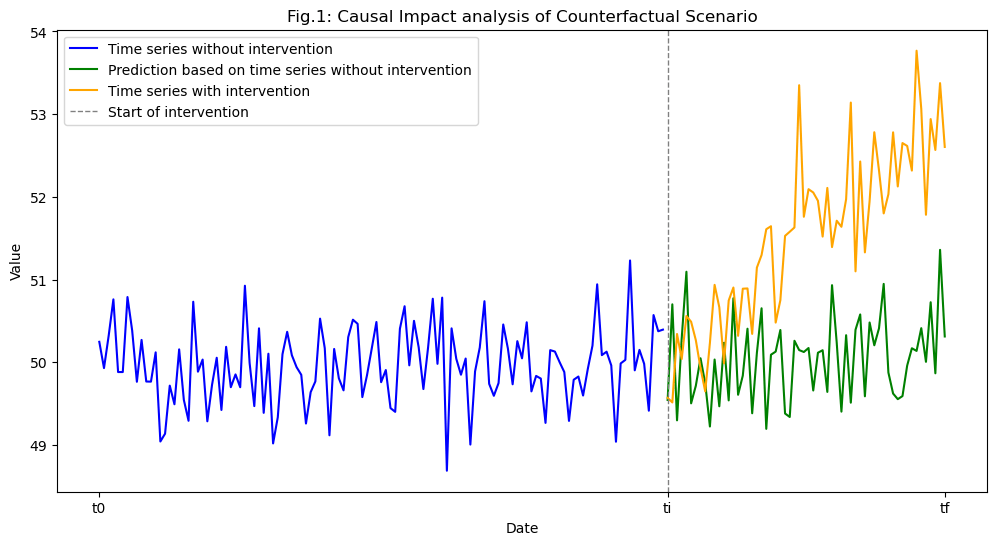
In Fig.1 we can see an example of the application of the Causal Impact. The three moments in time that characterize the analysis are:
- t0: The point in time when data observation begins.
- ti: The moment the intervention takes place.
- tf: The end of the observation period, when we measure the impact.

The entire period from t0 to tf is in the past, meaning we already have real data about what happened before and after the intervention. This data allows us to build and validate the model.
Here’s how it works step by step:
- Model Training: The Causal Impact model learns the behavior of the time series during the pre-intervention period (from t0 to ti). In this phase, it uses only the counterfactuals—external factors that naturally influence the time series.
- Prediction: Using the information learned, the model predicts what would have happened after the intervention (ti to tf) if no changes had occurred.
- Comparison: The predicted values are compared to the actual observed data. The difference between these two values shows the true impact of the intervention.

Interpreting the Results
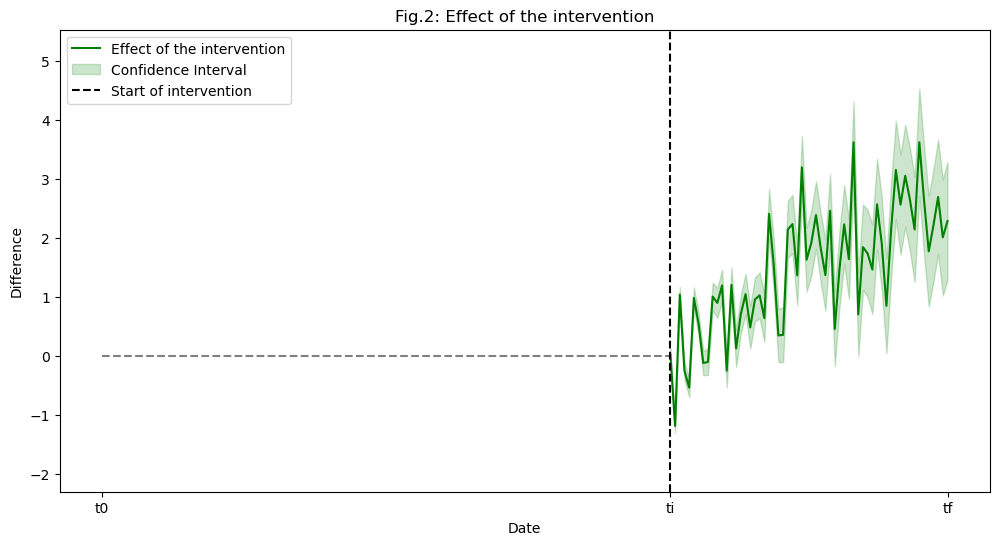
As the final step in the Causal Impact Analysis, the predicted values (derived from the counterfactual scenario) are compared with the real observed data after the intervention. The result is a curve that visualizes the difference between the two time series (see Fig. 2).
This difference represents the effect of the intervention:
- If the observed data shows a clear upward or downward trend compared to the predicted curve, it indicates a positive or negative impact of the intervention.
In addition to the effect size, the Causal Impact model provides a confidence interval (illustrated as the green area in Fig. 2). This interval reflects the model’s confidence that the observed effect is truly due to the intervention rather than random fluctuations or noise.
- A narrow confidence interval suggests higher certainty that the intervention caused the effect.
- A wider confidence interval indicates more uncertainty about the causal relationship.
Applications of Causal Impact Analysis
Causal Impact Analysis is a versatile tool that can be applied across various industries to measure and explain the effects of specific interventions. Some notable examples include:
- Business Decisions: Evaluate the impact of new strategies, such as product launches, pricing changes, or operational adjustments.
- Healthcare: Assess the effectiveness of a new treatment, therapy, or healthcare program on patient outcomes.
- Marketing: Measure the influence of campaigns or promotions on key metrics like sales, website traffic, or customer engagement.
In all these cases, Causal Impact provides clear, actionable insights into whether an intervention has worked and by how much, helping decision-makers validate their strategies with confidence.
Causal Impact at Nexoya
At Nexoya, we leverage Causal Impact Analysis to assess the effectiveness of our AI-driven budget allocation on the marketing performance of our clients. In simple terms, it helps us separate the real effect of our optimization efforts from background noise or external factors. This method ensures that the observed changes can be clearly attributed to the intervention itself, and not confounded by other factors or natural variations.
To achieve this, we carefully build a robust counterfactual scenario. We combine:
- General market trends (external factors), and
- Client-specific factors related to their unique marketing efforts.
By combining these external factors with client-specific trends, we can isolate the true impact of Nexoya’s AI Optimization.
Here’s how we implement Causal Impact step by step:
- Pre-Intervention (t0 to ti): We train the Causal Impact model using the selected counterfactuals. At this stage, we capture the natural performance of the client’s marketing efforts without the optimization applied.
- Post-Intervention (ti to tf): During this period, Nexoya’s AI Optimization comes into play, and we observe the real performance data.
- Comparison: If the observed data during the post-intervention period (ti to tf) is higher than the prediction generated by the model (counterfactual scenario), we can confidently attribute the improvement to Nexoya’s AI-driven optimization.
For example, if the predicted values suggest lower performance compared to the actual observed outcomes, it indicates a clear positive impact of our intervention.
This advanced approach allows us to quantify the performance boost delivered by Nexoya while filtering out all the noise and external variables. By clearly isolating the impact of our AI-driven budget optimization, we ensure that your performance improvements are measurable, reliable, and actionable.
If you’re looking to boost your marketing performance with a trusted, data-driven approach, schedule a call with one of our experts. We’ll be happy to show you how Nexoya can drive measurable results for your business.
To dive deeper into the theory behind Causal Impact Analysis, you can also explore Google’s detailed research here.