Time Period Comparison allows you to easily see how your cross-channel portfolio performed compared to last week, last month, or even last year. This feature gives you the insights you need with just a few clicks.
With Time Period Comparison, you can quickly compare the performance of your marketing campaigns between two different periods. This helps you understand how your strategies are evolving over time.
Why Use Time Period Comparison?
Comparing your current performance to past periods is key to optimizing your marketing efforts. Whether you’re tracking last month’s improvements or seeing how this year’s campaigns stack up against last year’s, this feature helps you spot trends, identify growth opportunities, and catch potential issues early.
How to Use the Time Period Comparison Feature:
Follow these four easy steps to compare your performance across various time periods:
- Select Your Portfolio: Begin by selecting the portfolio you would like to analyze.
- Select Your Time Period: Comparison will be made to the currently selected period. Make sure you’ve selected the correct date range using the date picker on the right side.
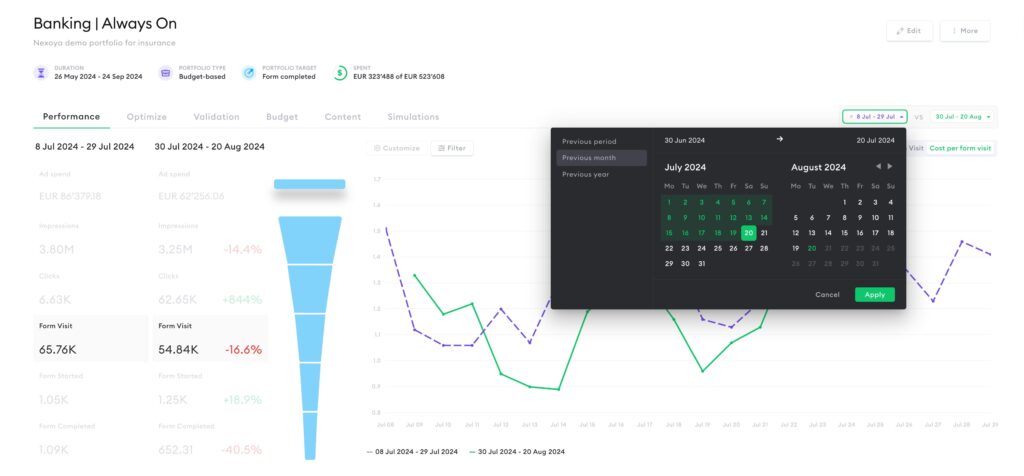
- Choose Your Comparison Period:
- In the Performance tab, look for the “plus” sign next to the date picker. Click on it to reveal your comparison options:
- Previous Period: Compares the selected time period with the same number of days in the preceding period (e.g., comparing July with June).
- Previous Month: Compares the selected time period with the same number of days of the previous month.
- Previous Year: Compares the selected time period with the same period in the previous year.
- In the Performance tab, look for the “plus” sign next to the date picker. Click on it to reveal your comparison options:
- Apply & Analyse: After selecting your desired comparison option, click “Apply”. Your performance data will now be displayed alongside the comparison period.
Interpreting Your Data
Whether you’re looking for a high-level overview or want to delve into the details, the Time Period Comparison feature has you covered.
High-Level Overview
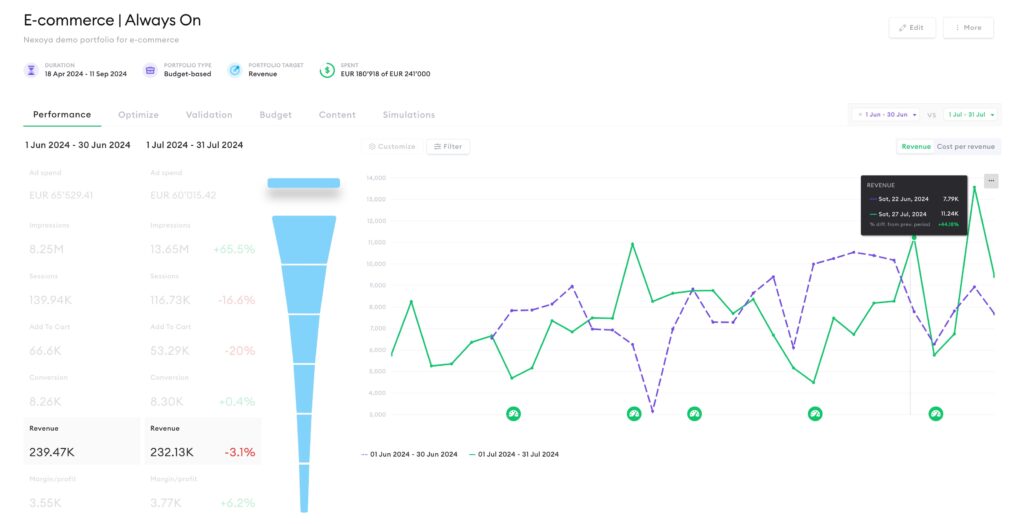
Get a comprehensive view of your portfolio’s overall performance using the funnel view. A new column displays data from the comparison period, and you can filter this view by channels and funnel steps to focus on specific areas and observe percentage changes.
- Visual Comparison: The graph provides a side-by-side visual of the selected period and the previous period.
- Green Line: Represents the performance of the selected “base” period.
- Purple Dotted Line: Represents the performance during the comparison period.
- Interactive Insights: Hover over the graph to view specific values and percentage changes, giving you quick access to key data points.
- Charts alignment: Keep in mind that the charts are aligned on weekdays.
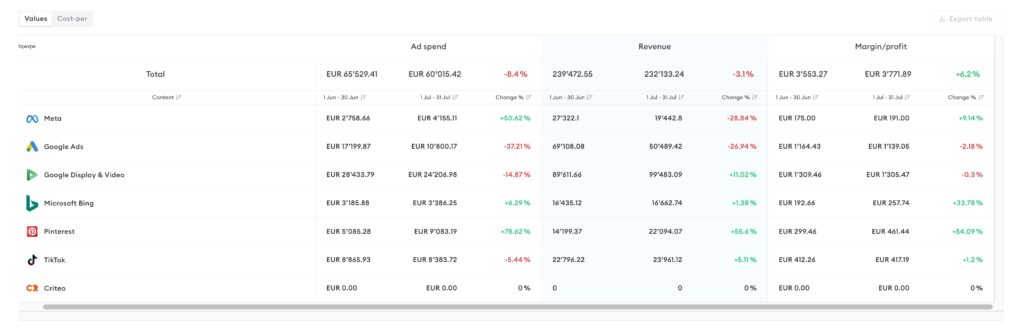
Detailed Table View
For a more in-depth analysis, scroll down to the detailed table report. This section allows you to break down performance at both the channel and campaign levels.
- Comparison Column: The table includes an additional column showing performance changes for the comparison period, enabling you to see precise differences in metrics.
- Customize Columns: You can adjust the table to display only the information most relevant to your needs, ensuring a tailored analysis.
Key benefits for you and your team
With the Time Period Comparison feature, you gain deeper insights into the effectiveness of your marketing strategies. Whether you’re tracking revenue growth, cost developments, or any other key performance indicators, this feature enables you to make data-driven decisions with ease.
Some of the key benefits:
- Simplified Data Analysis: Easily compare performance of your cross-channel portfolio across different periods.
- Identify Trends: Track how your performance evolves over time.
- Optimize Strategies: Make real-time adjustments based on insights.
- Validate Results: Clearly see the impact of your campaigns across different periods.
We believe this feature will significantly enhance your ability to monitor and optimize your marketing activities, offering a clearer view of your progress and helping you achieve your business goals.