Your simulation is ready for review? Fantastic! Now, let’s walk through how to interpret the results and extract the most valuable insights. If you haven’t yet set up your simulations, we recommend visiting How to Set Up Simulation page for a detailed guide on configuring a simulation tailored to your specific needs.
Reviewing Your Simulation
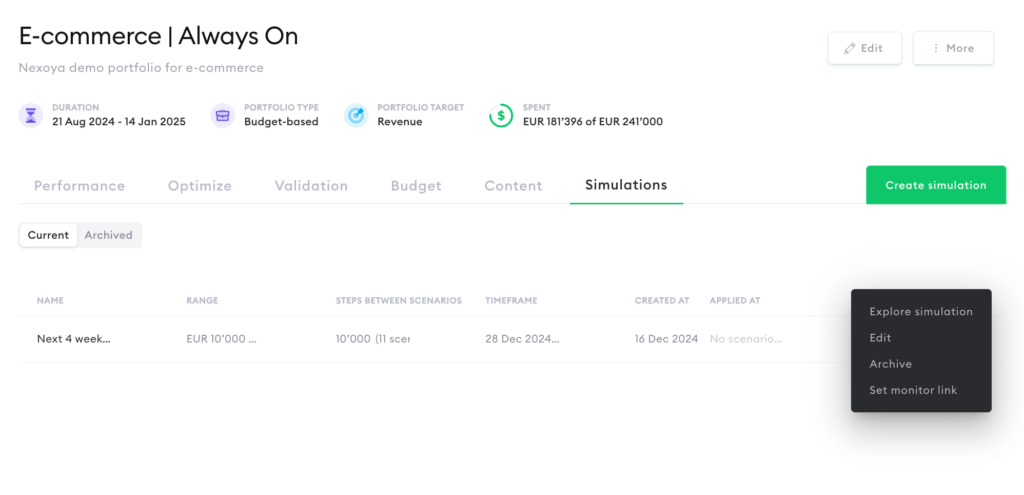
First, navigate to the “Simulations” section within your portfolio and select the simulation you’d like to explore.
How to Interpret the Results
Scenario Slider
Start by exploring the performance results for various scenarios. Use the slider to scroll through different budget ranges and assess the outcomes. As you adjust the toggle, you’ll see the performance metrics update accordingly, allowing you to compare the results for each budget scenario against the current state or base scenario.
What is base scenario?
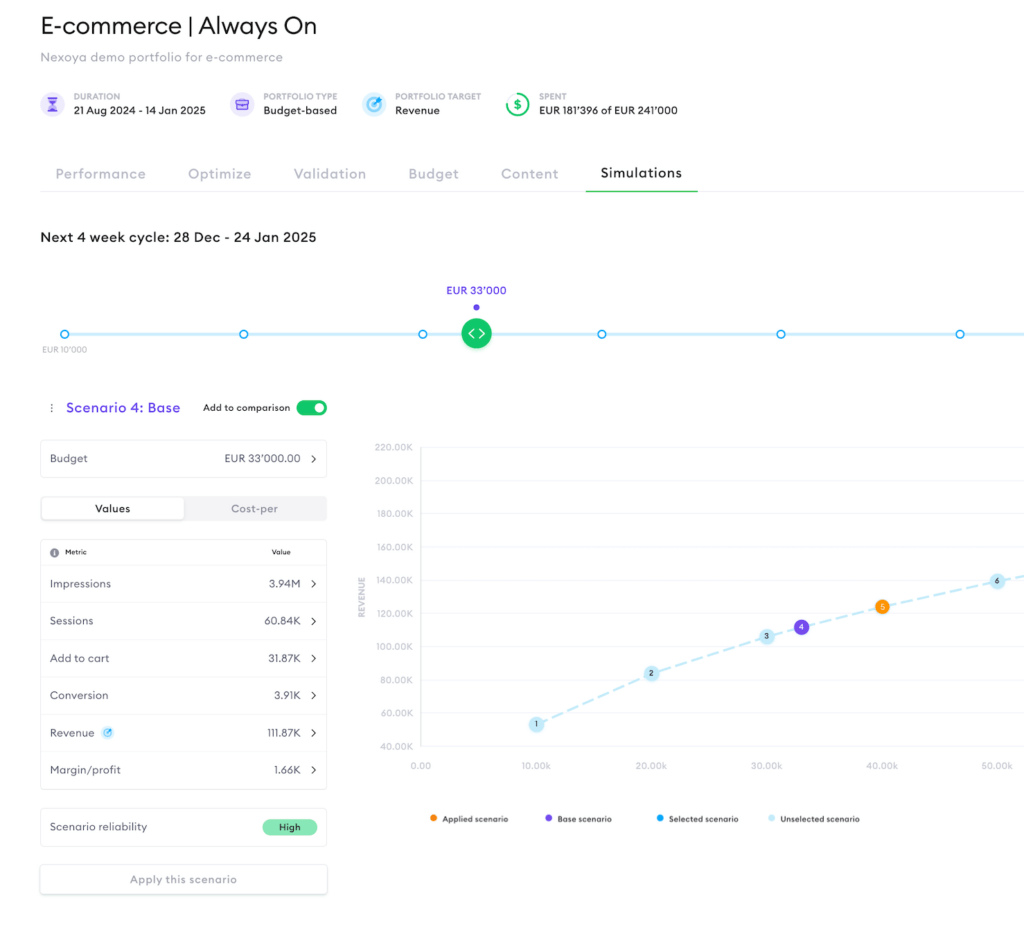
The Base Scenario is created based on the current budget plan you have created for the selected portfolio. It essentially predicts the performance of your portfolio if the simulation uses the budget plan as a basis. It is important to note that when simulating all scenarios, the algorithm takes into account all budget fluctuations that you have planned on the Budget tab.
Performance Table
On the left side, you’ll find a performance prediction table for each funnel step in your portfolio. This table displays key values as well as cost-per metrics and the predicted percentage difference from the base scenario. It provides a summary of the potential results you could achieve with each budget level.
As a result, this feature allows you to get data-driven insights and answer challenging questions with ease. Here are some examples:
- Evaluating Budget Adjustments: Imagine you’re planning your marketing strategy for the next quarter and need to decide how much budget you will need. With this feature, you can simulate the impact of a 20% budget adjustment on key performance metrics like sales, leads, and clicks. By using the slider above or selecting specific scenarios on the curve, you can instantly see the projected outcomes, enabling you to make informed decisions about scaling your budget up or down.
- Determining Required Budget for Specific Goals: If you have a specific goal in mind e.g. target cost per acquisition (CPA) or a specific conversion goal, this feature helps you determine the budget needed to achieve these objectives. By shifting the slider you can easily spot the budget required to achieve these goals and, therefore, plan your budget to meet your marketing goals with precision.
If you’d like to compare this scenario with others, simply add this scenario to the comparison report by switching on the toggle above the table. Learn more about comparing scenario functions below in the article.
Simulation Visualization & the Diminishing Return Curve
On the right side of your screen, you’ll find a graph that provides a clear visualization of all your simulation scenarios in one consolidated view. This powerful feature allows you to easily compare the performance outcomes across different investment levels, making it simple to identify the most optimal strategy.
The graph illustrates the diminishing returns of your entire advertising portfolio, showing how performance evolves as you increase or decrease your budget. This visualization is key to understanding when further investment will bring meaningful returns and when it becomes inefficient, allowing you to select the best possible scenario at any given moment.
By default, the x-axis displays the “Budget” while the y-axis shows your portfolio’s main target. You can also select and see the performance prediction for other metrics by changing them for the x-axis and y-axis.
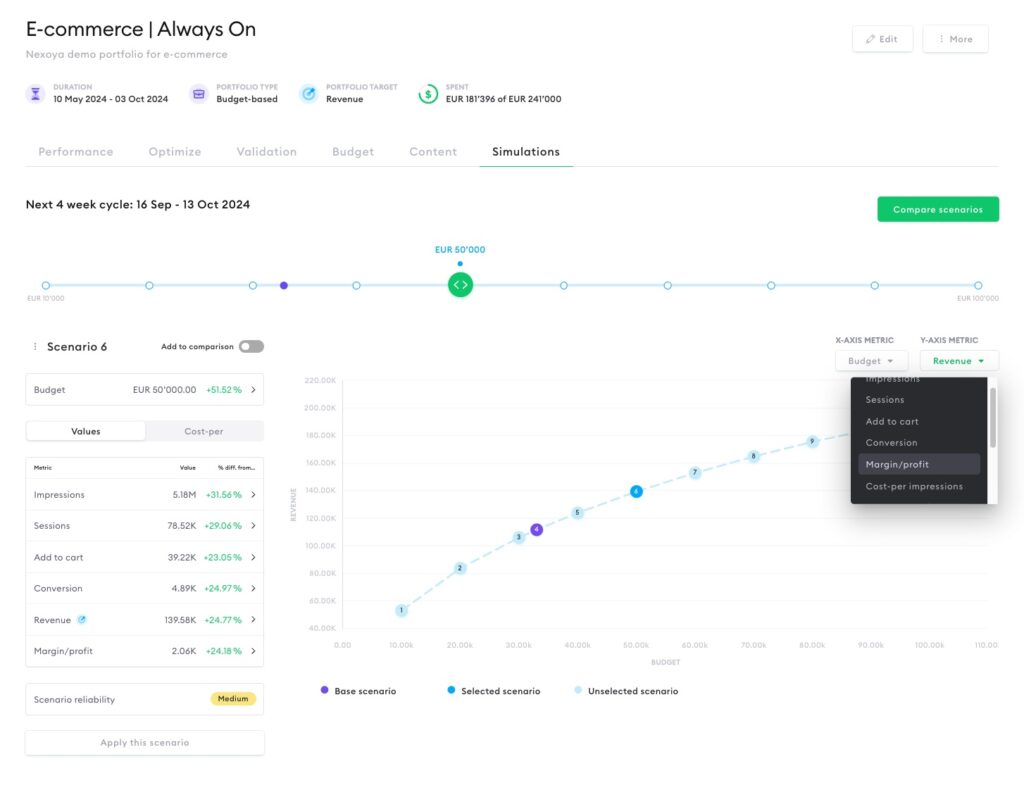
Light blue points indicate unselected options, the blue point marks the currently selected scenario, and the purple point represents the base scenario.
Once a scenario is applied, it is immediately reflected on your graph within the selected simulation. This simulation will also get an updated status in the main menu for easy tracking.
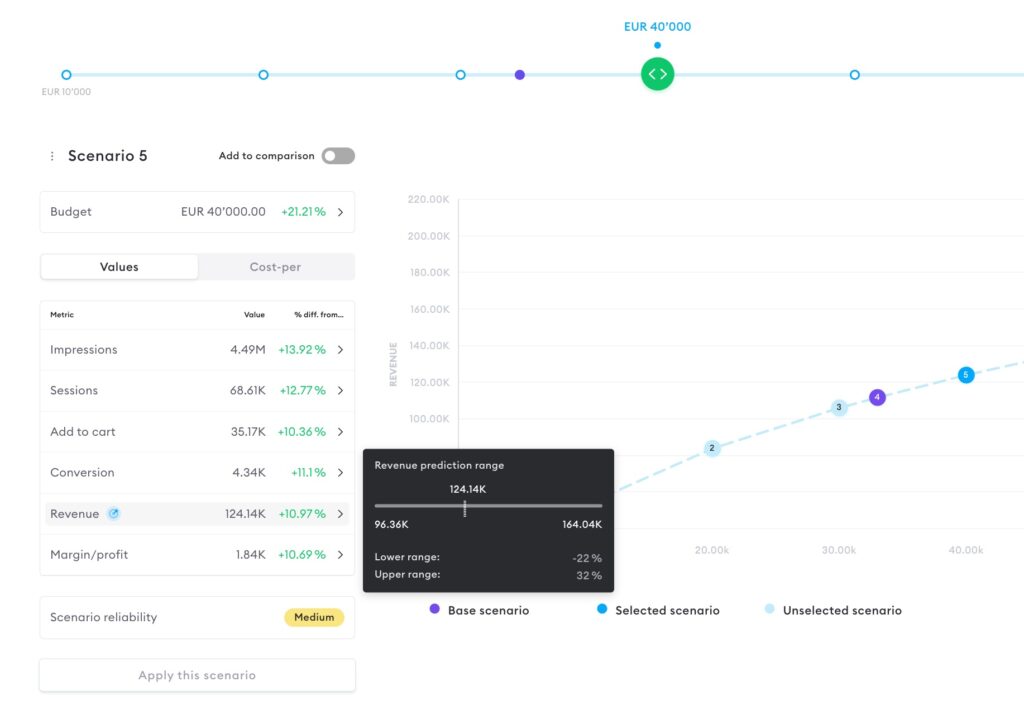
Scenario Reliability
Beneath the performance table, you’ll find the reliability score for each scenario, indicating the likelihood and precision of the predicted outcome. Scenarios with high reliability scores are more likely to deliver the expected results, giving you greater confidence in your decisions.
Moreover, you can get a more detailed view and see confidence intervals for each performance metric. Simply hover over a metric in the performance table, and a tooltip will appear, providing you with this valuable insight.
Comparing Scenarios
Need to communicate your marketing budget plan effectively to your finance department or team? Data-driven results make a compelling case. With Nexoya’s Scenario Simulation feature, you can compare all selected scenarios and generate a summary table that showcases the outcomes at different investment levels.
How to Compare Scenarios
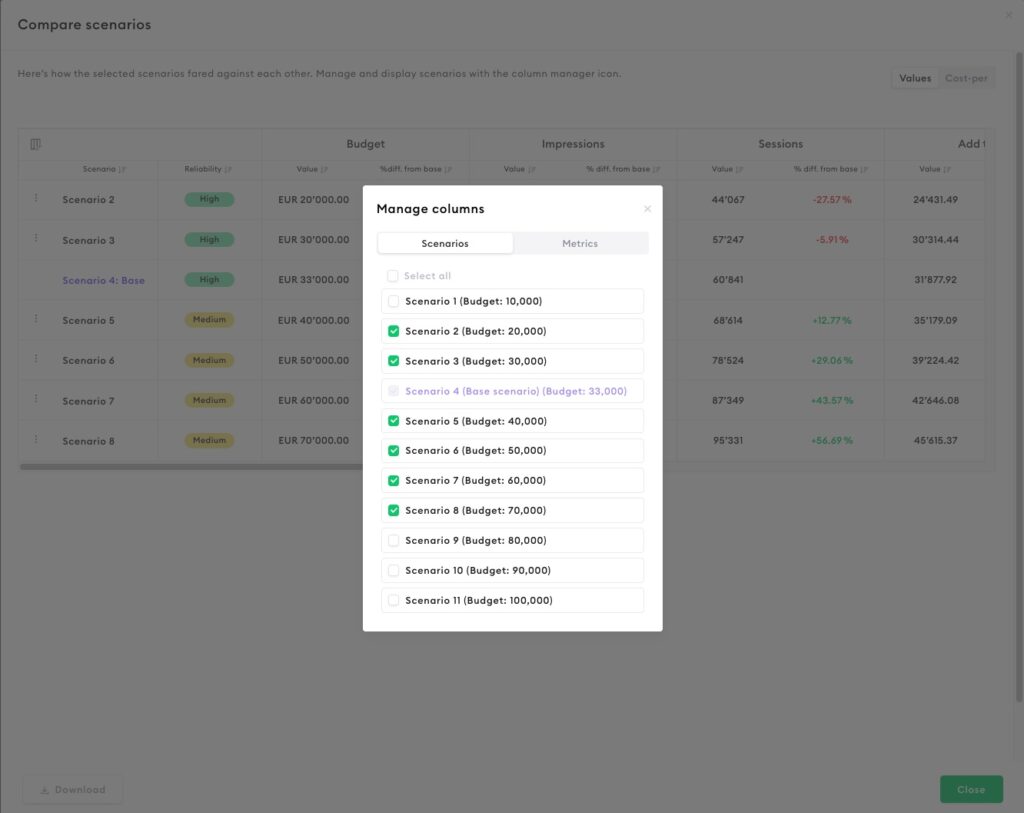
To compare scenarios, you can either:
- Add scenarios “manually” by toggling the switch above the performance table.
- Click the “Compare Scenarios” button in the top right corner.
If no scenarios have been manually added, the comparison table will appear empty or only shows the base scenario, if available. To extend it, click on “Manage Columns,” where you can select and add multiple scenarios to the comparison table. You can also customize the metrics you wish to see in this table.
Need to share your findings? Easily download the comparison table as a report by clicking on the “Download” button.
Monitoring and archiving simulations
Would you like to track the performance of the applied scenario?
Link your scenario to a monitoring dashboard or URL to track performance effortlessly. A convenient shortcut will be added to the simulation screen, giving you quick access to the relevant dashboard with just a few clicks.
Interested in activating the monitoring dashboard? Simply reach out to your Customer Success Manager to get it set up!
Time to archive the simulation? Safely store old simulations in the archive folder for future reference. You can revisit them anytime you want. This feature helps you stay focused on current simulations by tidying up outdated or irrelevant ones.
That’s it! You’ve now mastered the art of interpreting Scenario Simulation results.
Note: To activate the feature, reach out to your Customer Success Manager or leave your request here.